The TICK stack is a collection of products from the developers of the time-series database InfluxDB. It is made up of the following components:
You can use each of these components separately, but if you use them together, you’ll have a scalable, integrated open-source system for processing time-series data.
In this tutorial you’ll set up and use this platform as an open-source monitoring system. You’ll generate a bit of CPU usage and receive an email alert when the usage gets too high.
Now login back to ansible control host.
Create a new ansible playbook named tick-stack.yml
This ansilbe playbook will perform:
(venv) vmX-gY@ansible-host:~/ansible-playbook$ vi tick-stack.yml
- hosts: tick_stack_hosts
  become: true
  tasks:
    - name: Download Influxdb Repo apt key for Ubuntu
      apt_key:
        url: "https://repos.influxdata.com/influxdb.key"
        state: present
      tags: install

    - name: Add Influxdb Repo (Ubuntu 18)
      apt_repository:
        repo: "deb http://repos.influxdata.com/ubuntu bionic stable"
        filename: "influxdb-repo"
        state: present
      tags: install

    - name: Ensure package cache is up to date
      apt: update_cache=yes cache_valid_time=3600
      tags: install

    - name: Install TICK stack
      package:
        name: "{{ item }}"
        state: present
      with_items:
        - telegraf
        - influxdb
        - chronograf
        - kapacitor
      tags: install

    - name: Ensure tick stack is running and enabled at boot
      service:
        name: "{{ item }}"
        state: started
        enabled: false
      with_items:
        - telegraf
        - influxdb
        - chronograf
        - kapacitor
      tags: install

    - name: Configure Kapacitor SMTP
      lineinfile:
        path: /etc/kapacitor/kapacitor.conf
        regexp: '^  no-verify = false'
        line: '  no-verify = true'
      notify: restart kapacitor
      tags: config

    - name: Add other datasource to telegraf
      copy:
        src: 'files/telegraf/{{ item }}'
        dest: '/etc/telegraf/telegraf.d/'
      with_items:
        - network.conf
        - ping.conf
        - snmp.conf
      notify: restart telegraf
      tags: config

  handlers:
    - name: restart telegraf
      service:
        name: telegraf
        state: restarted

    - name: restart kapacitor
      service:
        name: kapacitor
        state: restarted
update inventory/hosts as following
(venv) vmX-gY@ansible-host:~/ansible-playbook$ vi inventory/hosts
[nagios_hosts]
vmX-gY.lab.workalaya.net

[snmp_hosts]
vmX-gY.lab.workalaya.net

[smokeping_hosts]
vmX-gY.lab.workalaya.net

[netdot_hosts]
vmX-gY.lab.workalaya.net

[rancid_hosts]
vmX-gY.lab.workalaya.net

[nfsen_hosts]
vmX-gY.lab.workalaya.net
srv1-gY.lab.workalaya.net

[syslog_hosts]
srv1-gY.lab.workalaya.net

[cacti_hosts]
vmX-gY.lab.workalaya.net

[tick_stack_hosts]
vmX-gY.lab.workalaya.net
now we create few additional datasources file for telegraf as
(venv) vmX-gY@ansible-host:~/ansible-playbook$ mkdir -p files/telegraf
(venv) vmX-gY@ansible-host:~/ansible-playbook$ vi files/telegraf/network.conf
[[inputs.net]]
(venv) vmX-gY@ansible-host:~/ansible-playbook$ vi ffiles/telegraf/ping.conf
[[inputs.ping]]
urls = [
    "www.lab.workalaya.net",
    "gw-rtr.lab.workalaya.net",
    "rtr1-gY.lab.workalaya.net",
    "vm1-gY.lab.workalaya.net",
    "vm2-gY.lab.workalaya.net",
    "vm3-gY.lab.workalaya.net",
    "srv1-gY.lab.workalaya.net",
    "ansible-gY.lab.workalaya.net"
]
(venv) vmX-gY@ansible-host:~/ansible-playbook$ vi ffiles/telegraf/snmp.conf
[[inputs.snmp]]
  agents = [ "rtr1-gY.lab.workalaya.net" ]
  version = 2
  community = "NetManage"
  interval = "60s"
  timeout = "10s"
  retries = 3
  name = "snmp"

  [[inputs.snmp.field]]
    name = "hostname"
    oid = "RFC1213-MIB::sysName.0"
    is_tag = true

  [[inputs.snmp.field]]
    name = "uptime"
    oid = "DISMAN-EXPRESSION-MIB::sysUpTimeInstance"

  # IF-MIB::ifTable contains counters on input and output traffic as well as errors and discards.
  [[inputs.snmp.table]]
    name = "interface"
    inherit_tags = [ "hostname" ]
    oid = "IF-MIB::ifTable"

    # Interface tag - used to identify interface in metrics database
    [[inputs.snmp.table.field]]
      name = "ifDescr"
      oid = "IF-MIB::ifDescr"
      is_tag = true

  # IF-MIB::ifXTable contains newer High Capacity (HC) counters that do not overflow as fast for a few of the ifTable counters
  [[inputs.snmp.table]]
    name = "interface"
    inherit_tags = [ "hostname" ]
    oid = "IF-MIB::ifXTable"

    # Interface tag - used to identify interface in metrics database
    [[inputs.snmp.table.field]]
      name = "ifDescr"
      oid = "IF-MIB::ifDescr"
      is_tag = true
Now run ansible playbook to install TICK stack
(venv) vmX-gY@ansible-host:~/ansible-playbook$ ansible-playbook tick-stack.yml

PLAY [tick_stack_hosts] **************************************************************************************************************************************

TASK [Gathering Facts] ***************************************************************************************************************************************
ok: [vmX-gY.lab.workalaya.net]

TASK [Download Influxdb Repo apt key for Ubuntu] *************************************************************************************************************
changed: [vmX-gY.lab.workalaya.net]

TASK [Add Influxdb Repo (Ubuntu 18)] *************************************************************************************************************************
changed: [vmX-gY.lab.workalaya.net]

TASK [Ensure package cache is up to date] ********************************************************************************************************************
[WARNING]: Could not find aptitude. Using apt-get instead

ok: [vmX-gY.lab.workalaya.net]

TASK [Install TICK stack] ************************************************************************************************************************************
changed: [vmX-gY.lab.workalaya.net] => (item=telegraf)
changed: [vmX-gY.lab.workalaya.net] => (item=influxdb)
changed: [vmX-gY.lab.workalaya.net] => (item=chronograf)
changed: [vmX-gY.lab.workalaya.net] => (item=kapacitor)

TASK [Ensure tick stack is running and enabled at boot] ******************************************************************************************************
changed: [vmX-gY.lab.workalaya.net] => (item=telegraf)
changed: [vmX-gY.lab.workalaya.net] => (item=influxdb)
changed: [vmX-gY.lab.workalaya.net] => (item=chronograf)
changed: [vmX-gY.lab.workalaya.net] => (item=kapacitor)

TASK [Configure Kapacitor SMTP] ******************************************************************************************************************************
changed: [vmX-gY.lab.workalaya.net]

TASK [Add other datasource to telegraf] **********************************************************************************************************************
changed: [vmX-gY.lab.workalaya.net] => (item=network.conf)
changed: [vmX-gY.lab.workalaya.net] => (item=ping.conf)
changed: [vmX-gY.lab.workalaya.net] => (item=snmp.conf)

RUNNING HANDLER [restart telegraf] ***************************************************************************************************************************
changed: [vmX-gY.lab.workalaya.net]

RUNNING HANDLER [restart kapacitor] **************************************************************************************************************************
changed: [vmX-gY.lab.workalaya.net]

PLAY RECAP ***************************************************************************************************************************************************
vmX-gY.lab.workalaya.net   : ok=10   changed=8    unreachable=0    failed=0    skipped=0    rescued=0    ignored=0
Now use a web browser and open the following address:
http://vmX-gY.lab.workalaya.net:8888/
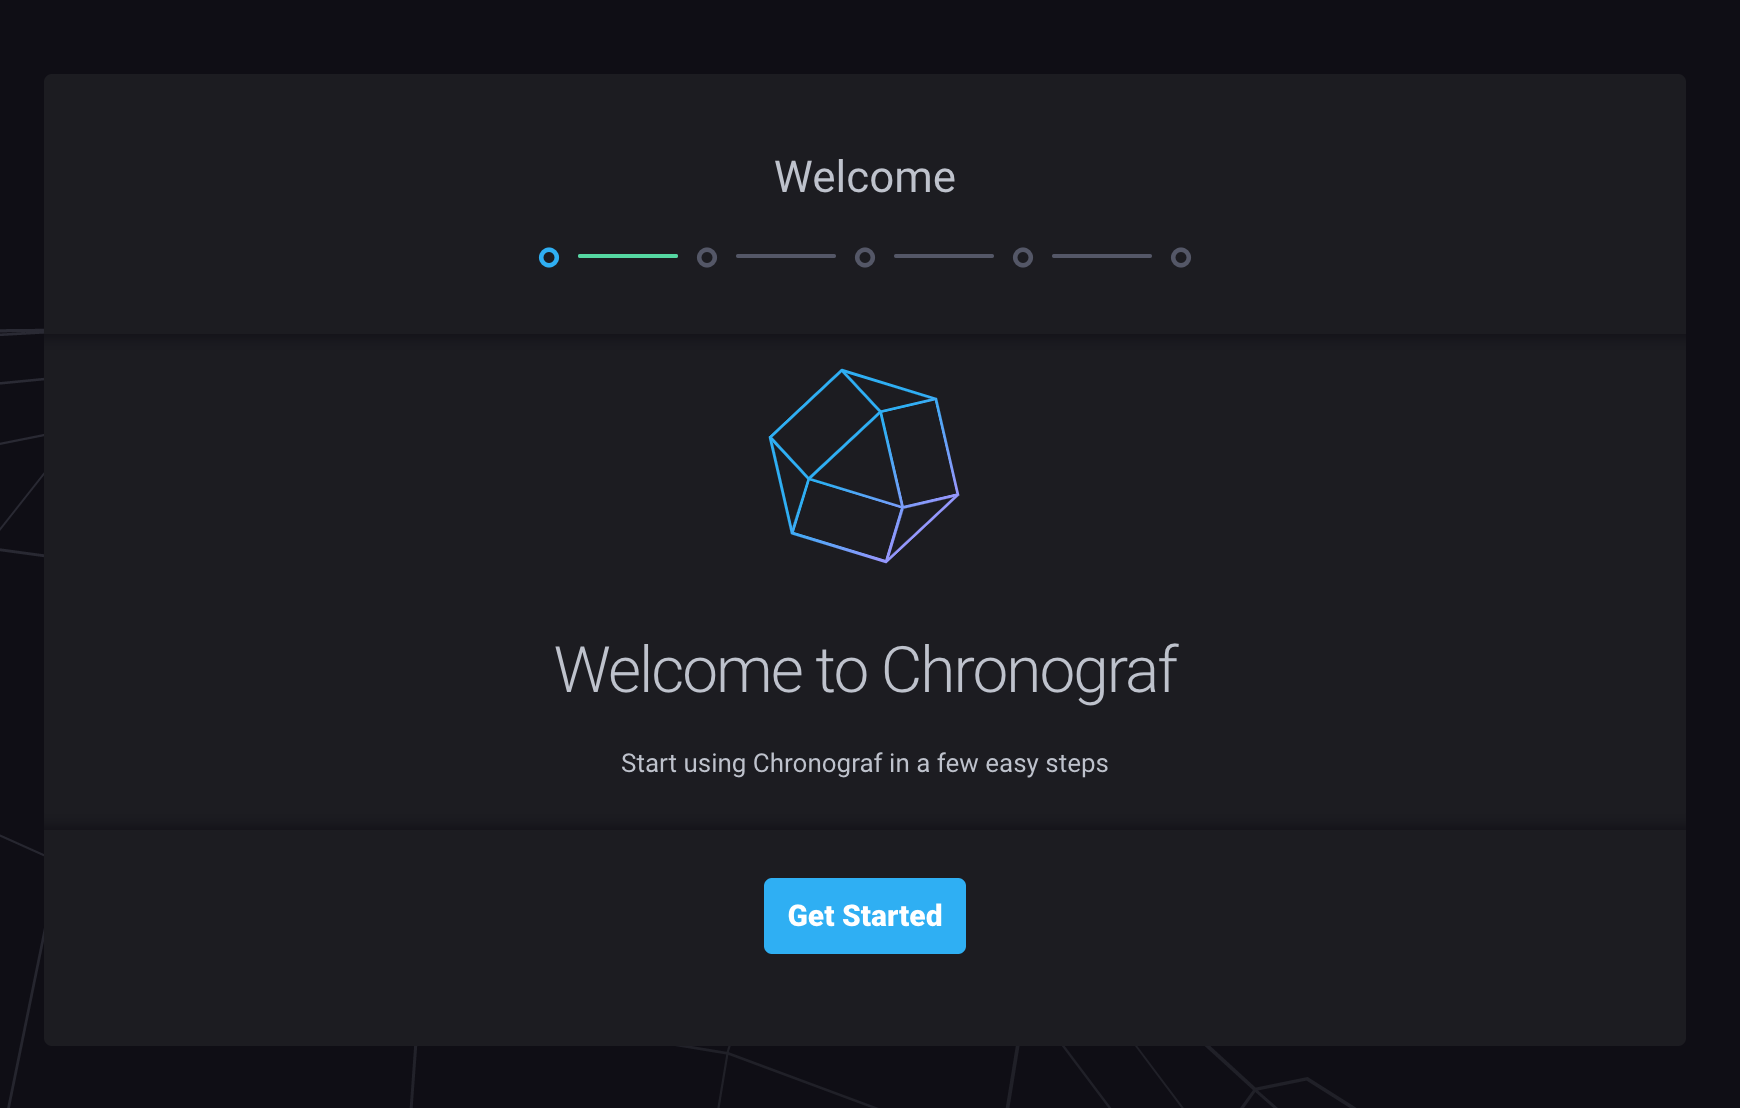
You’ll see a welcome page like the one in the following figure:
Click Get Started button, then you see following:
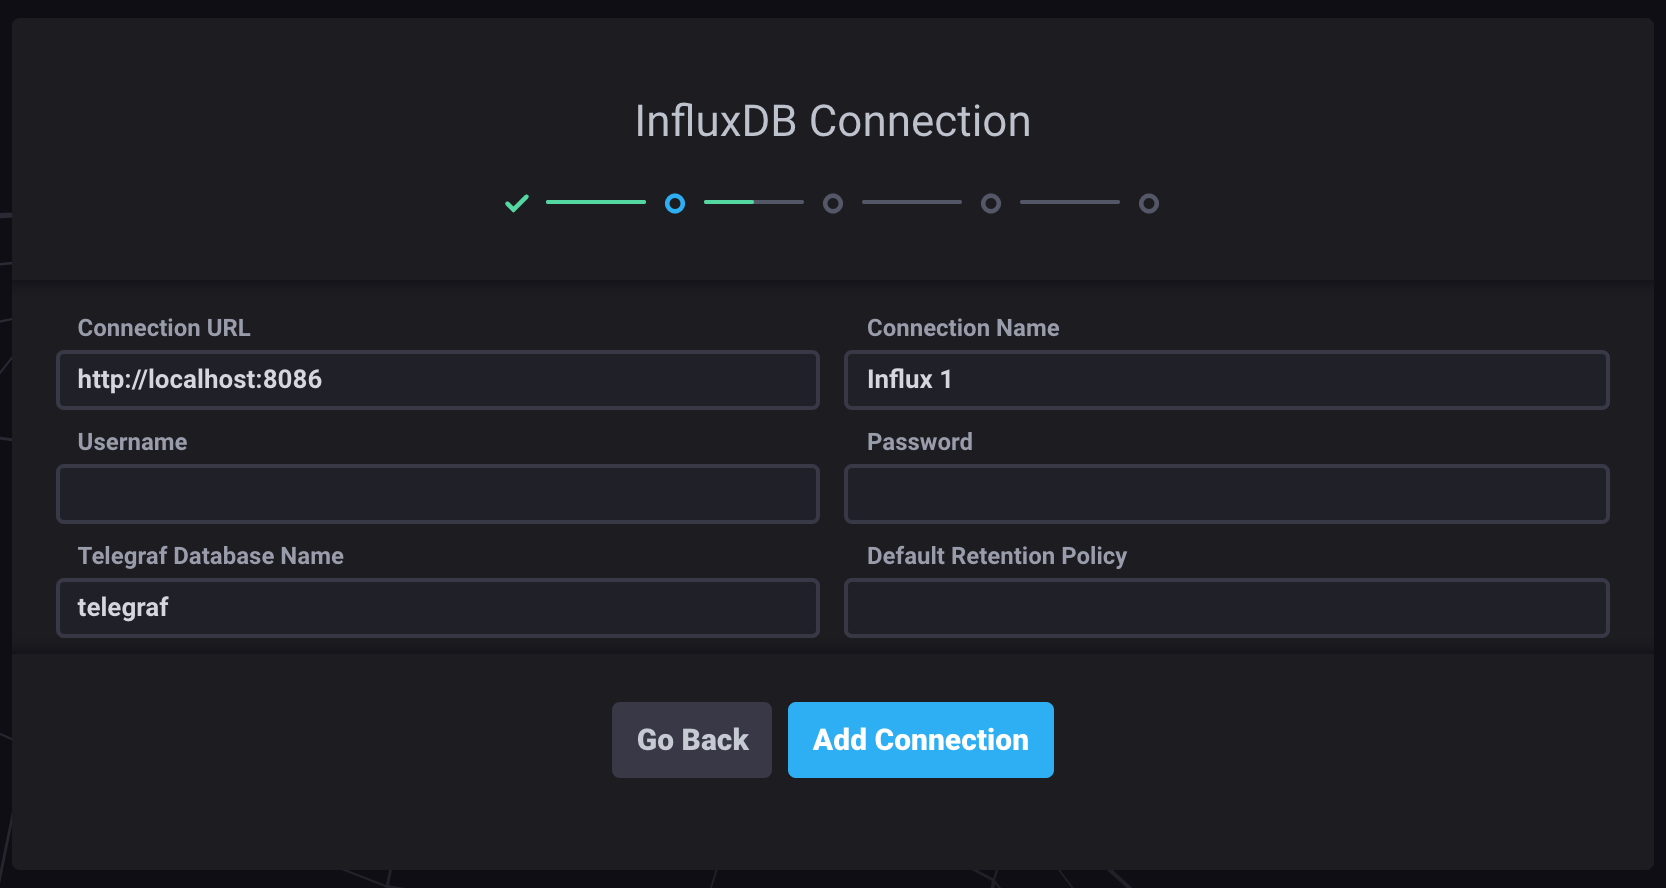
Use the default connection details; we didn’t configure a username and password for the InfluxDB database. Click Connect New Source to proceed.
Note: We have not created any user in InfluxDB for this lab. For Production use do create user to make it is more secure.
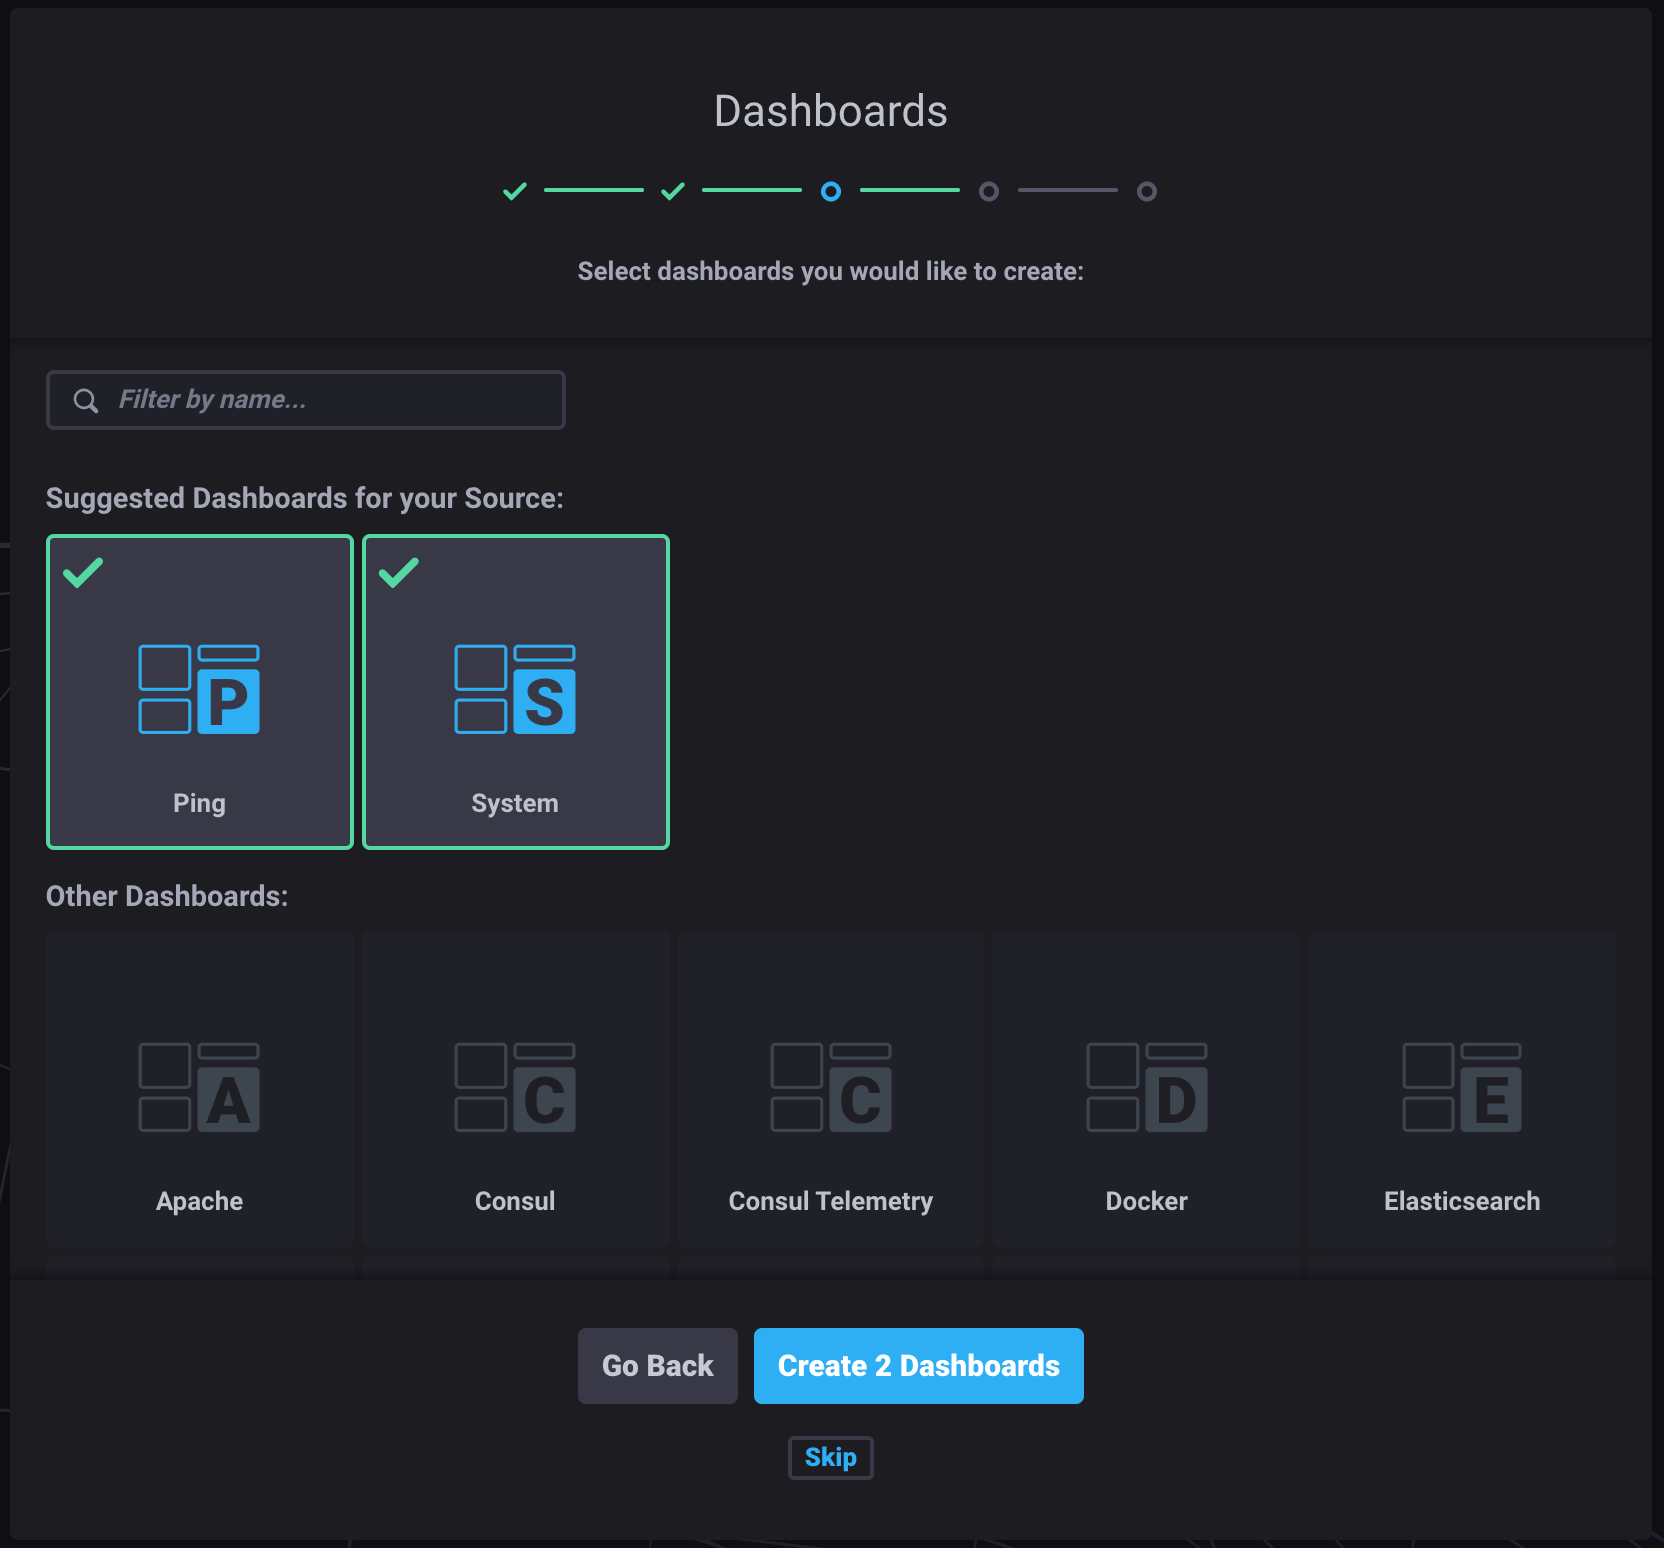
You will prompted to select dashboards you like to create.
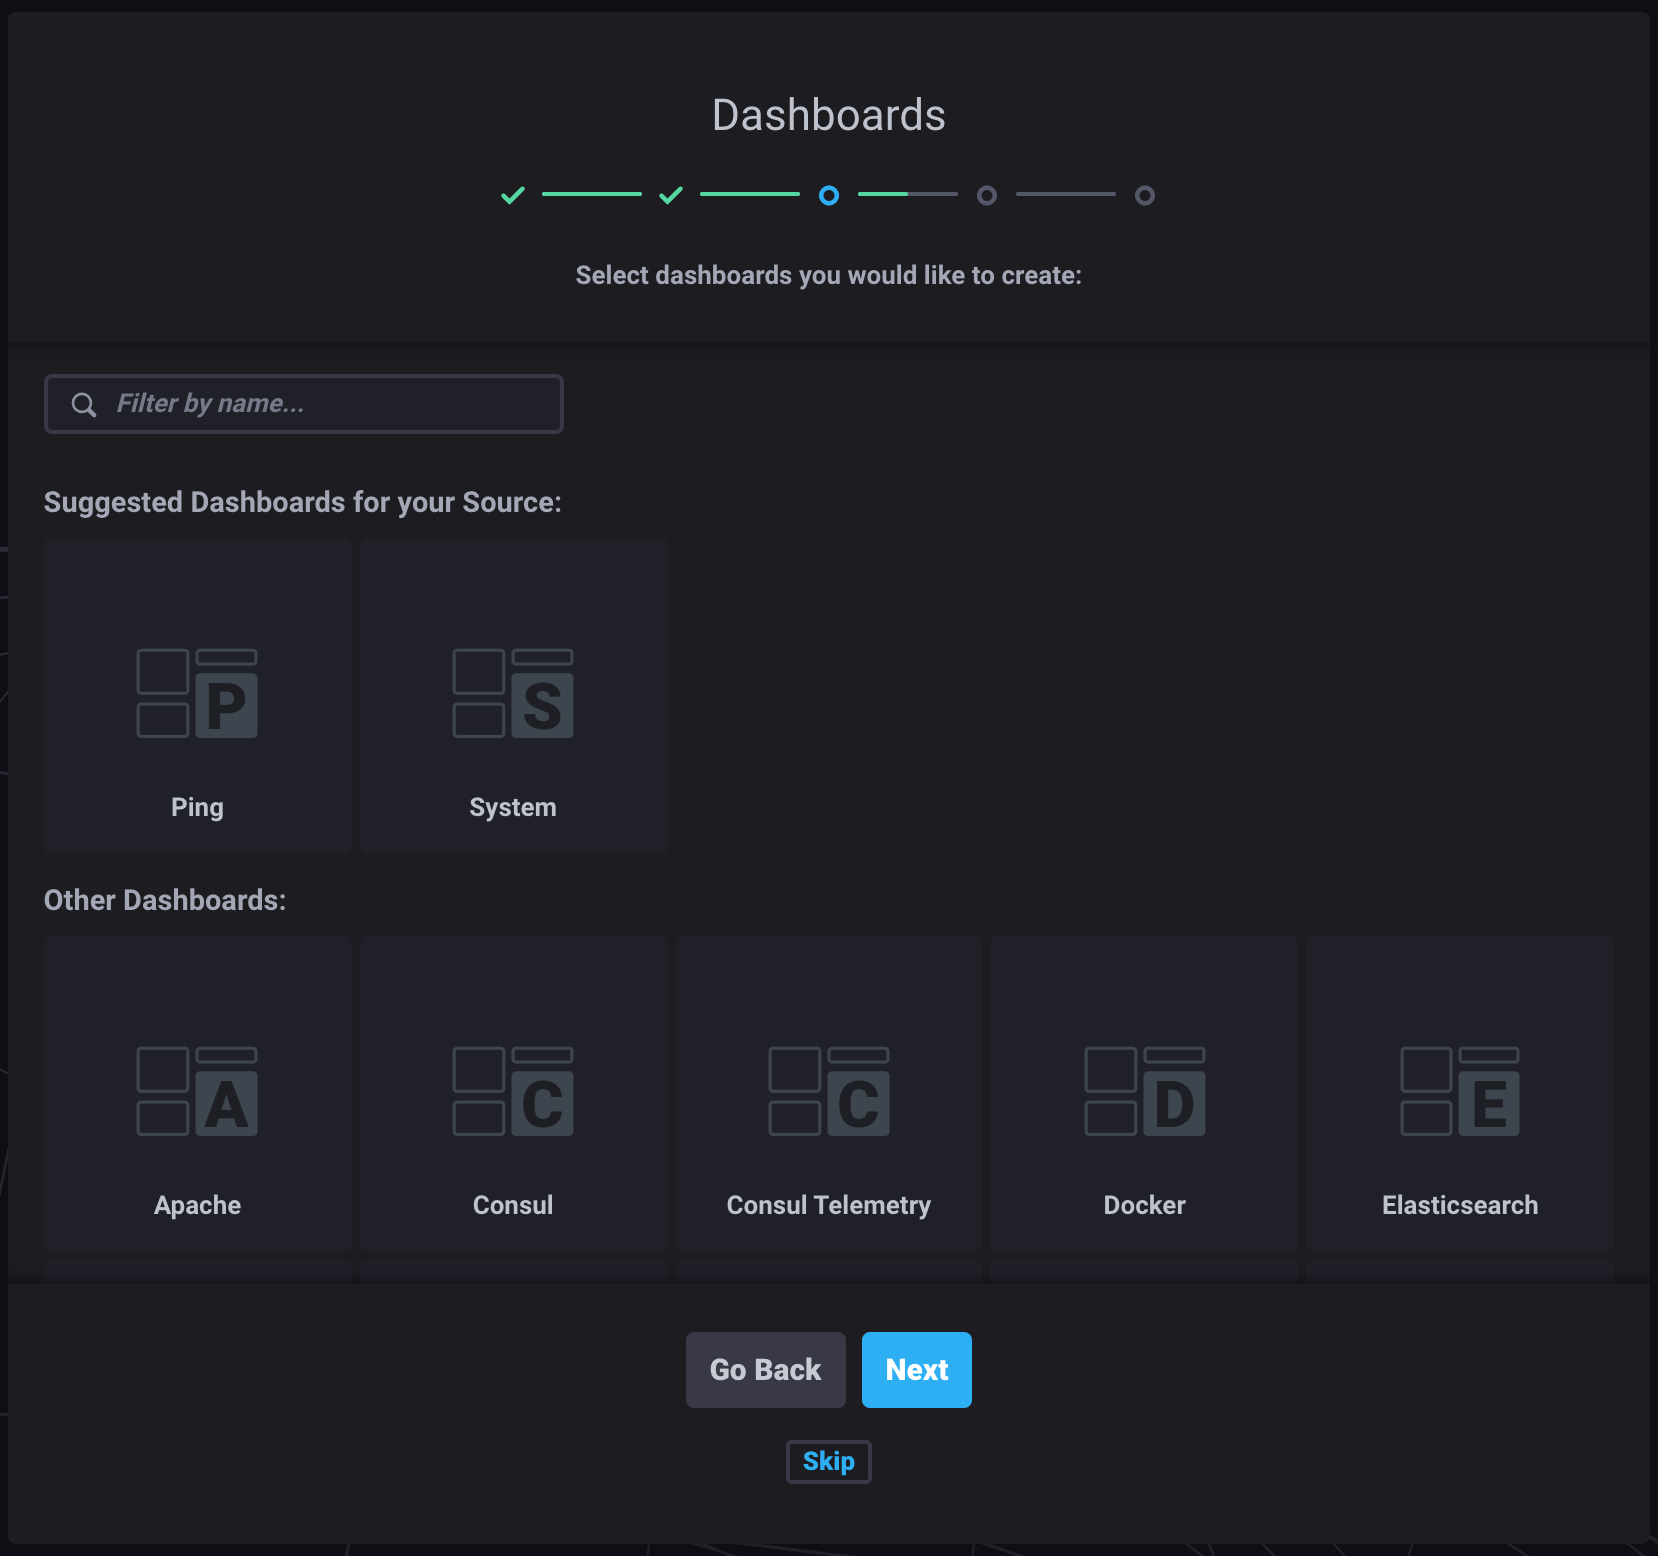
Click Ping, System and then click Create 2 Dashboards
Next you will see Kapacitor Connection configuration screen
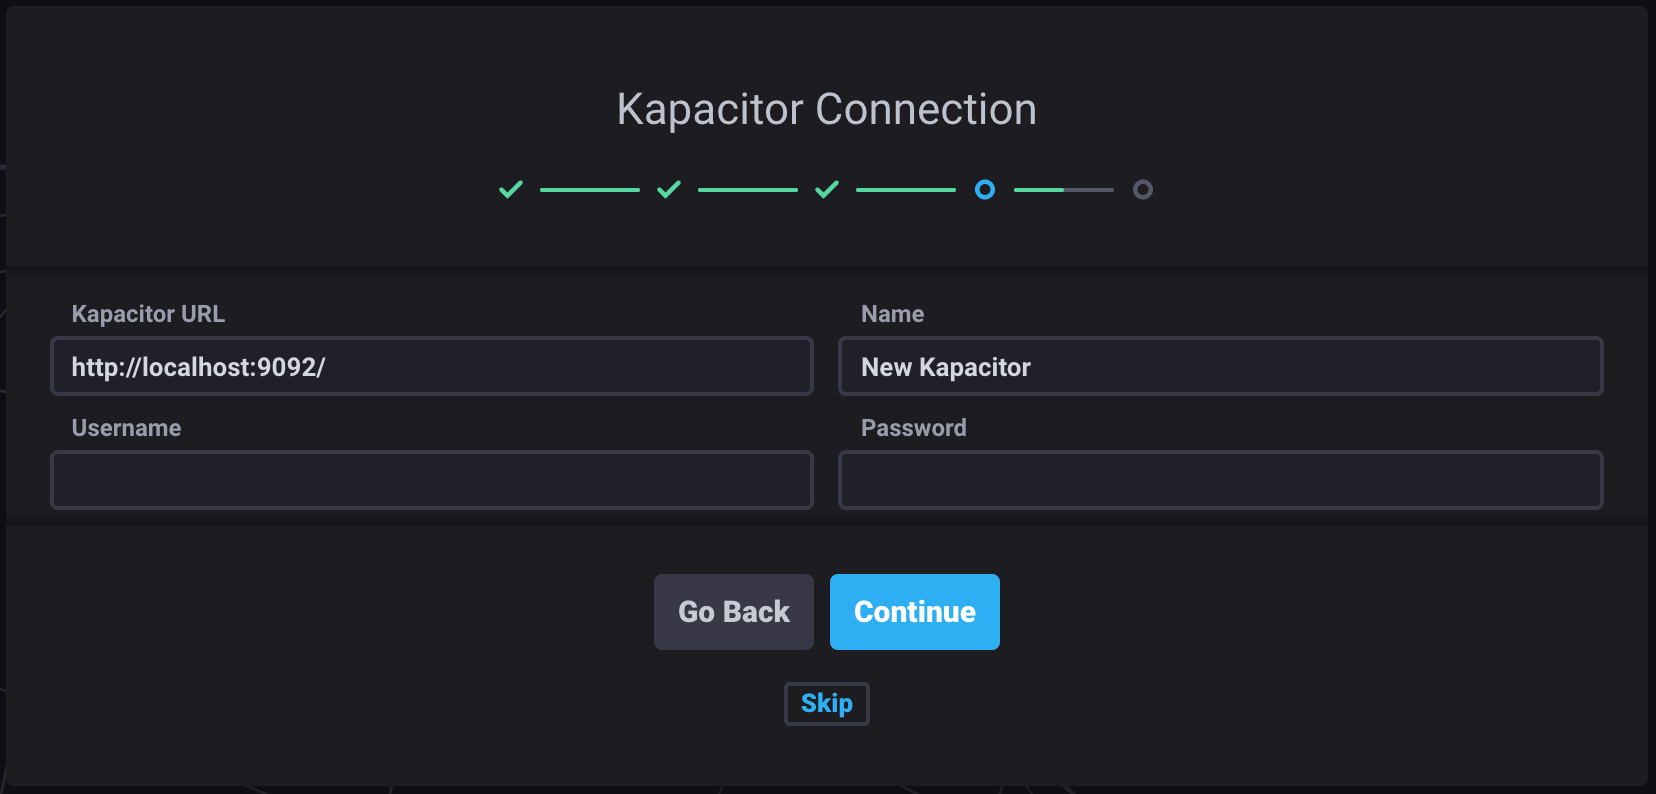
Use the default connection details; we didn’t configure a username and password for Kapacitor Connection. Click Continue to proceed.
Note: We have not created any user in Kapacitor Connection for this lab. For Production use do create user to make it is more secure.
Next you will see setup complete screen
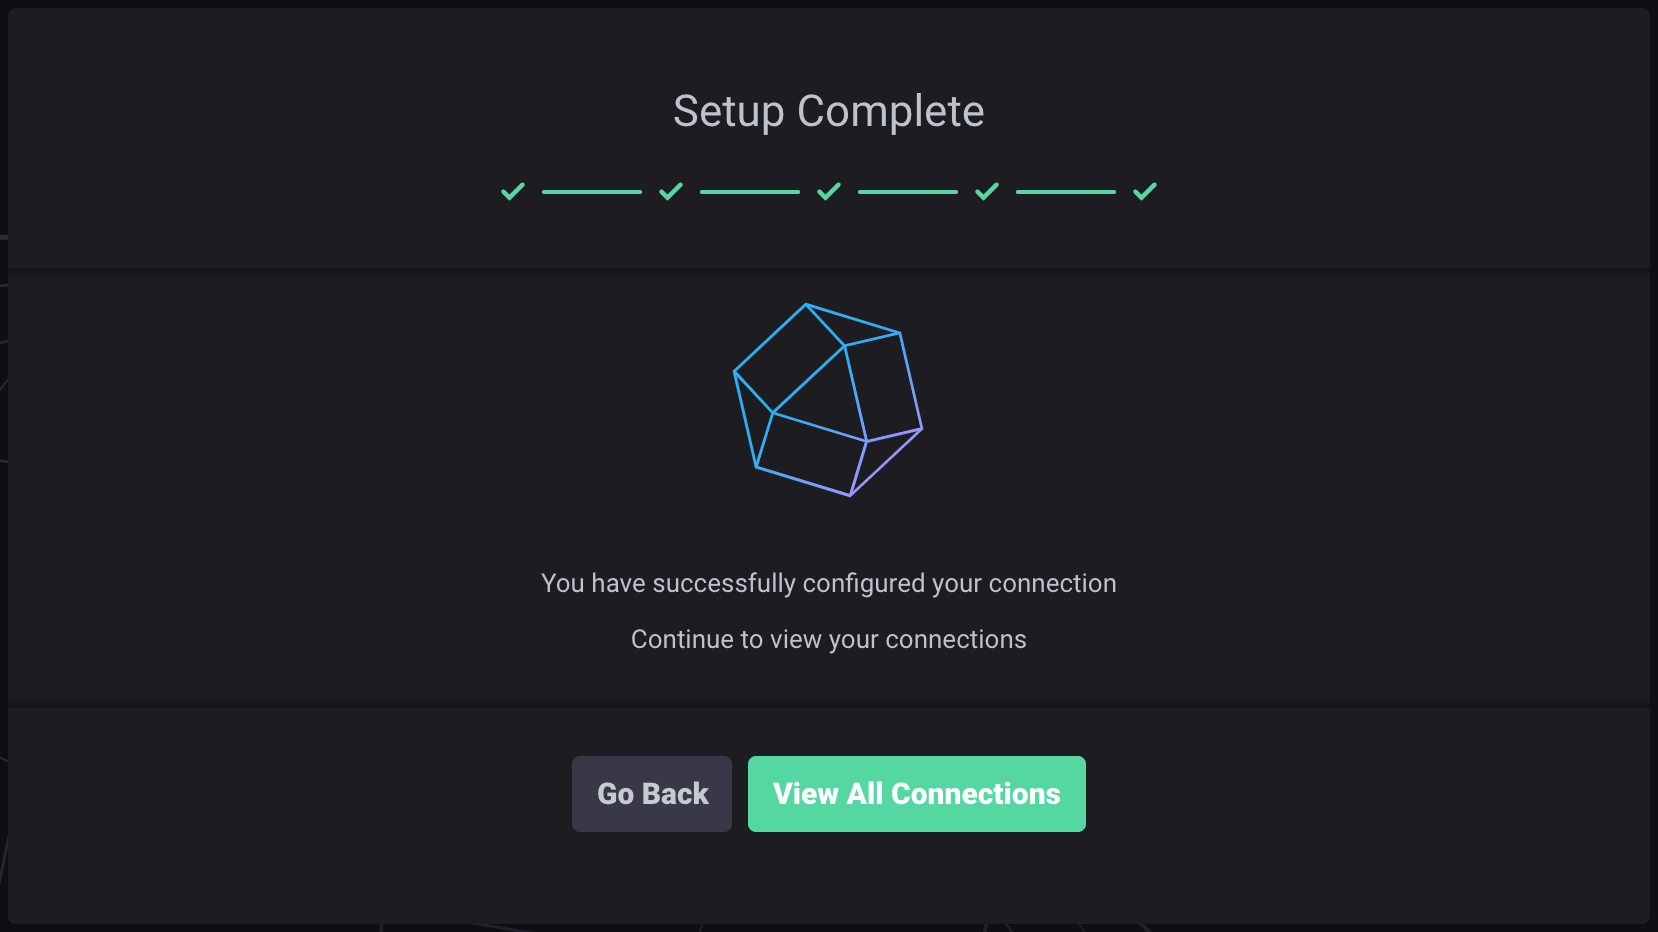
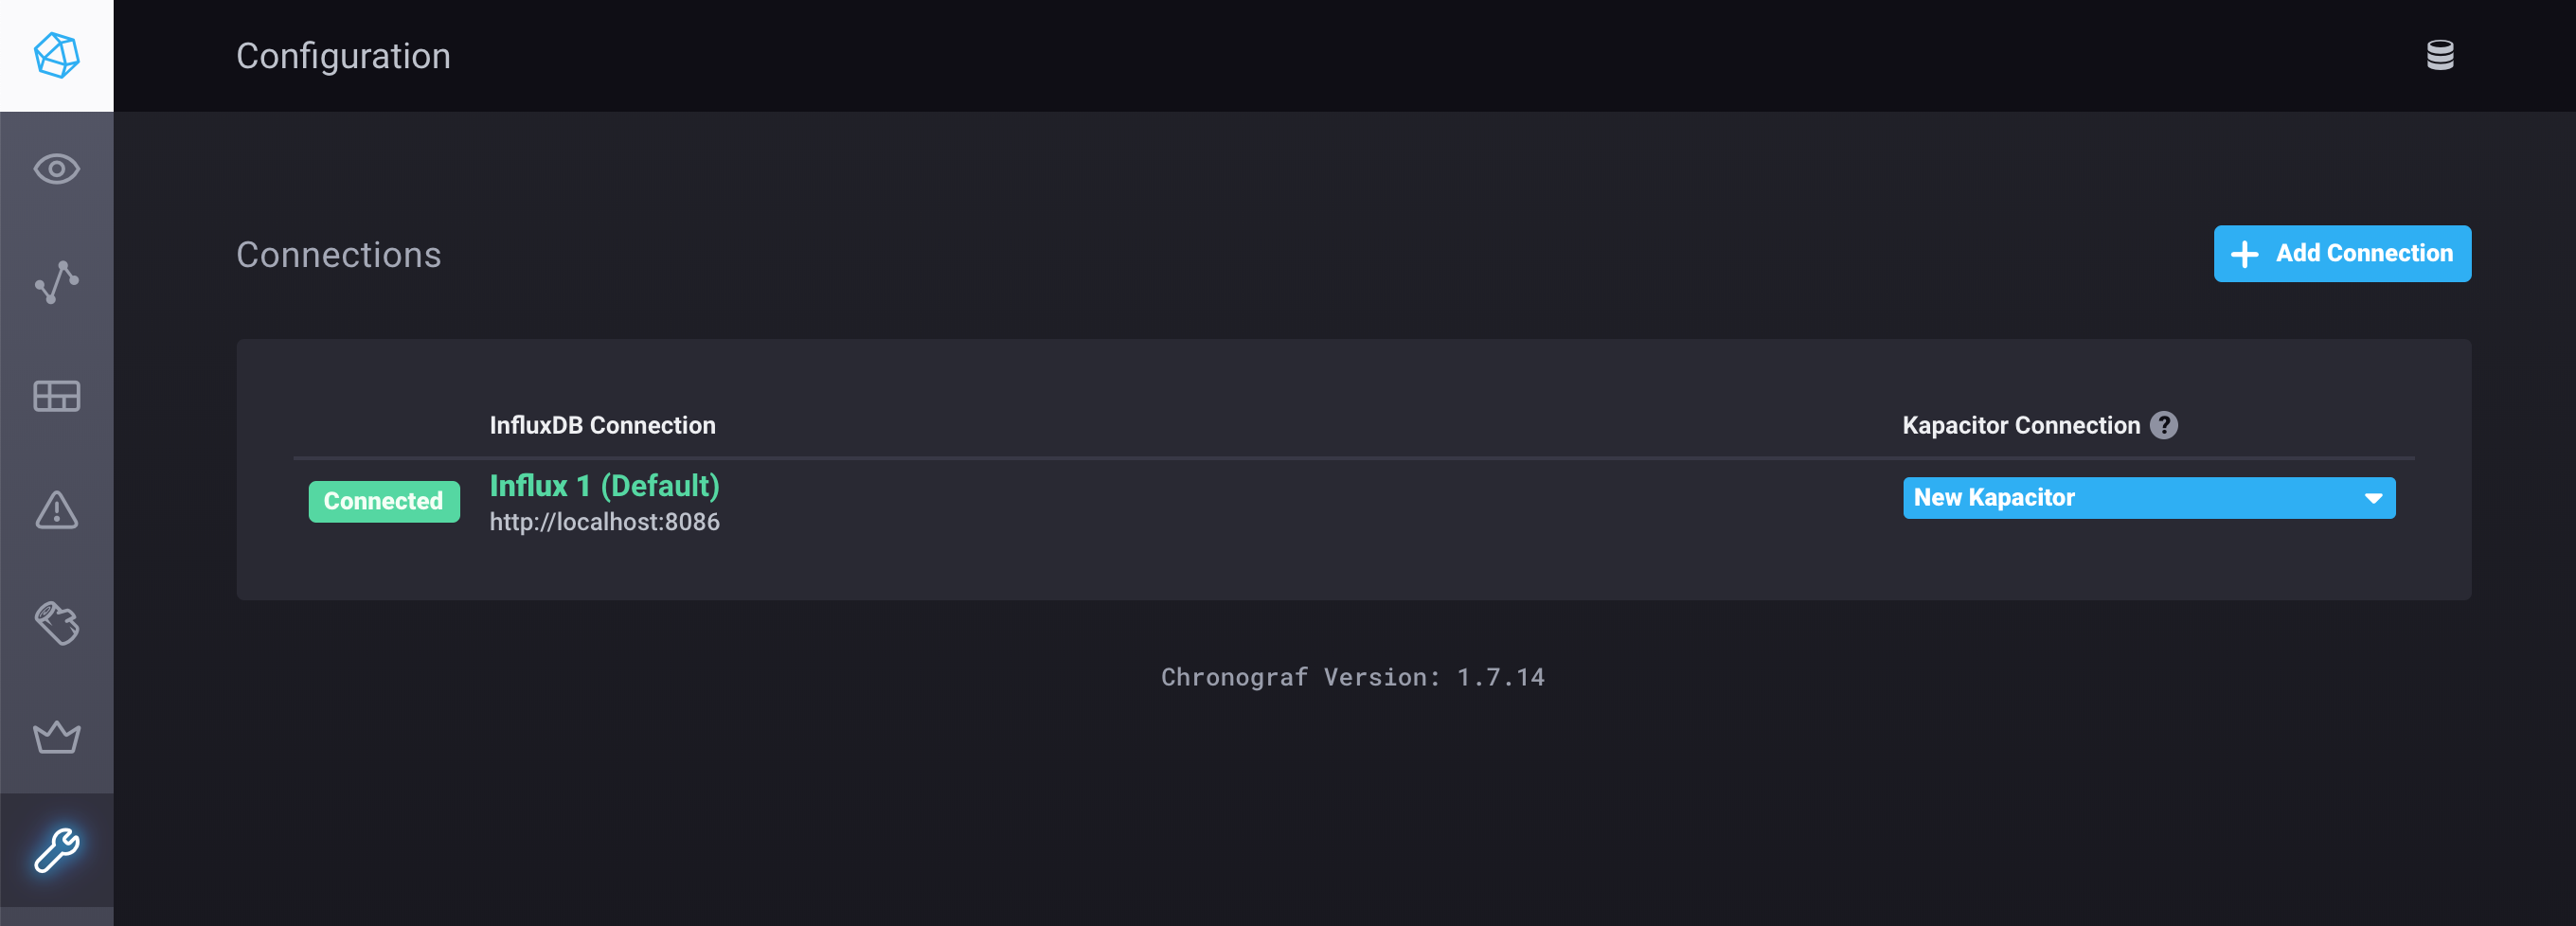
Now click View All Connections then you will see similar screen
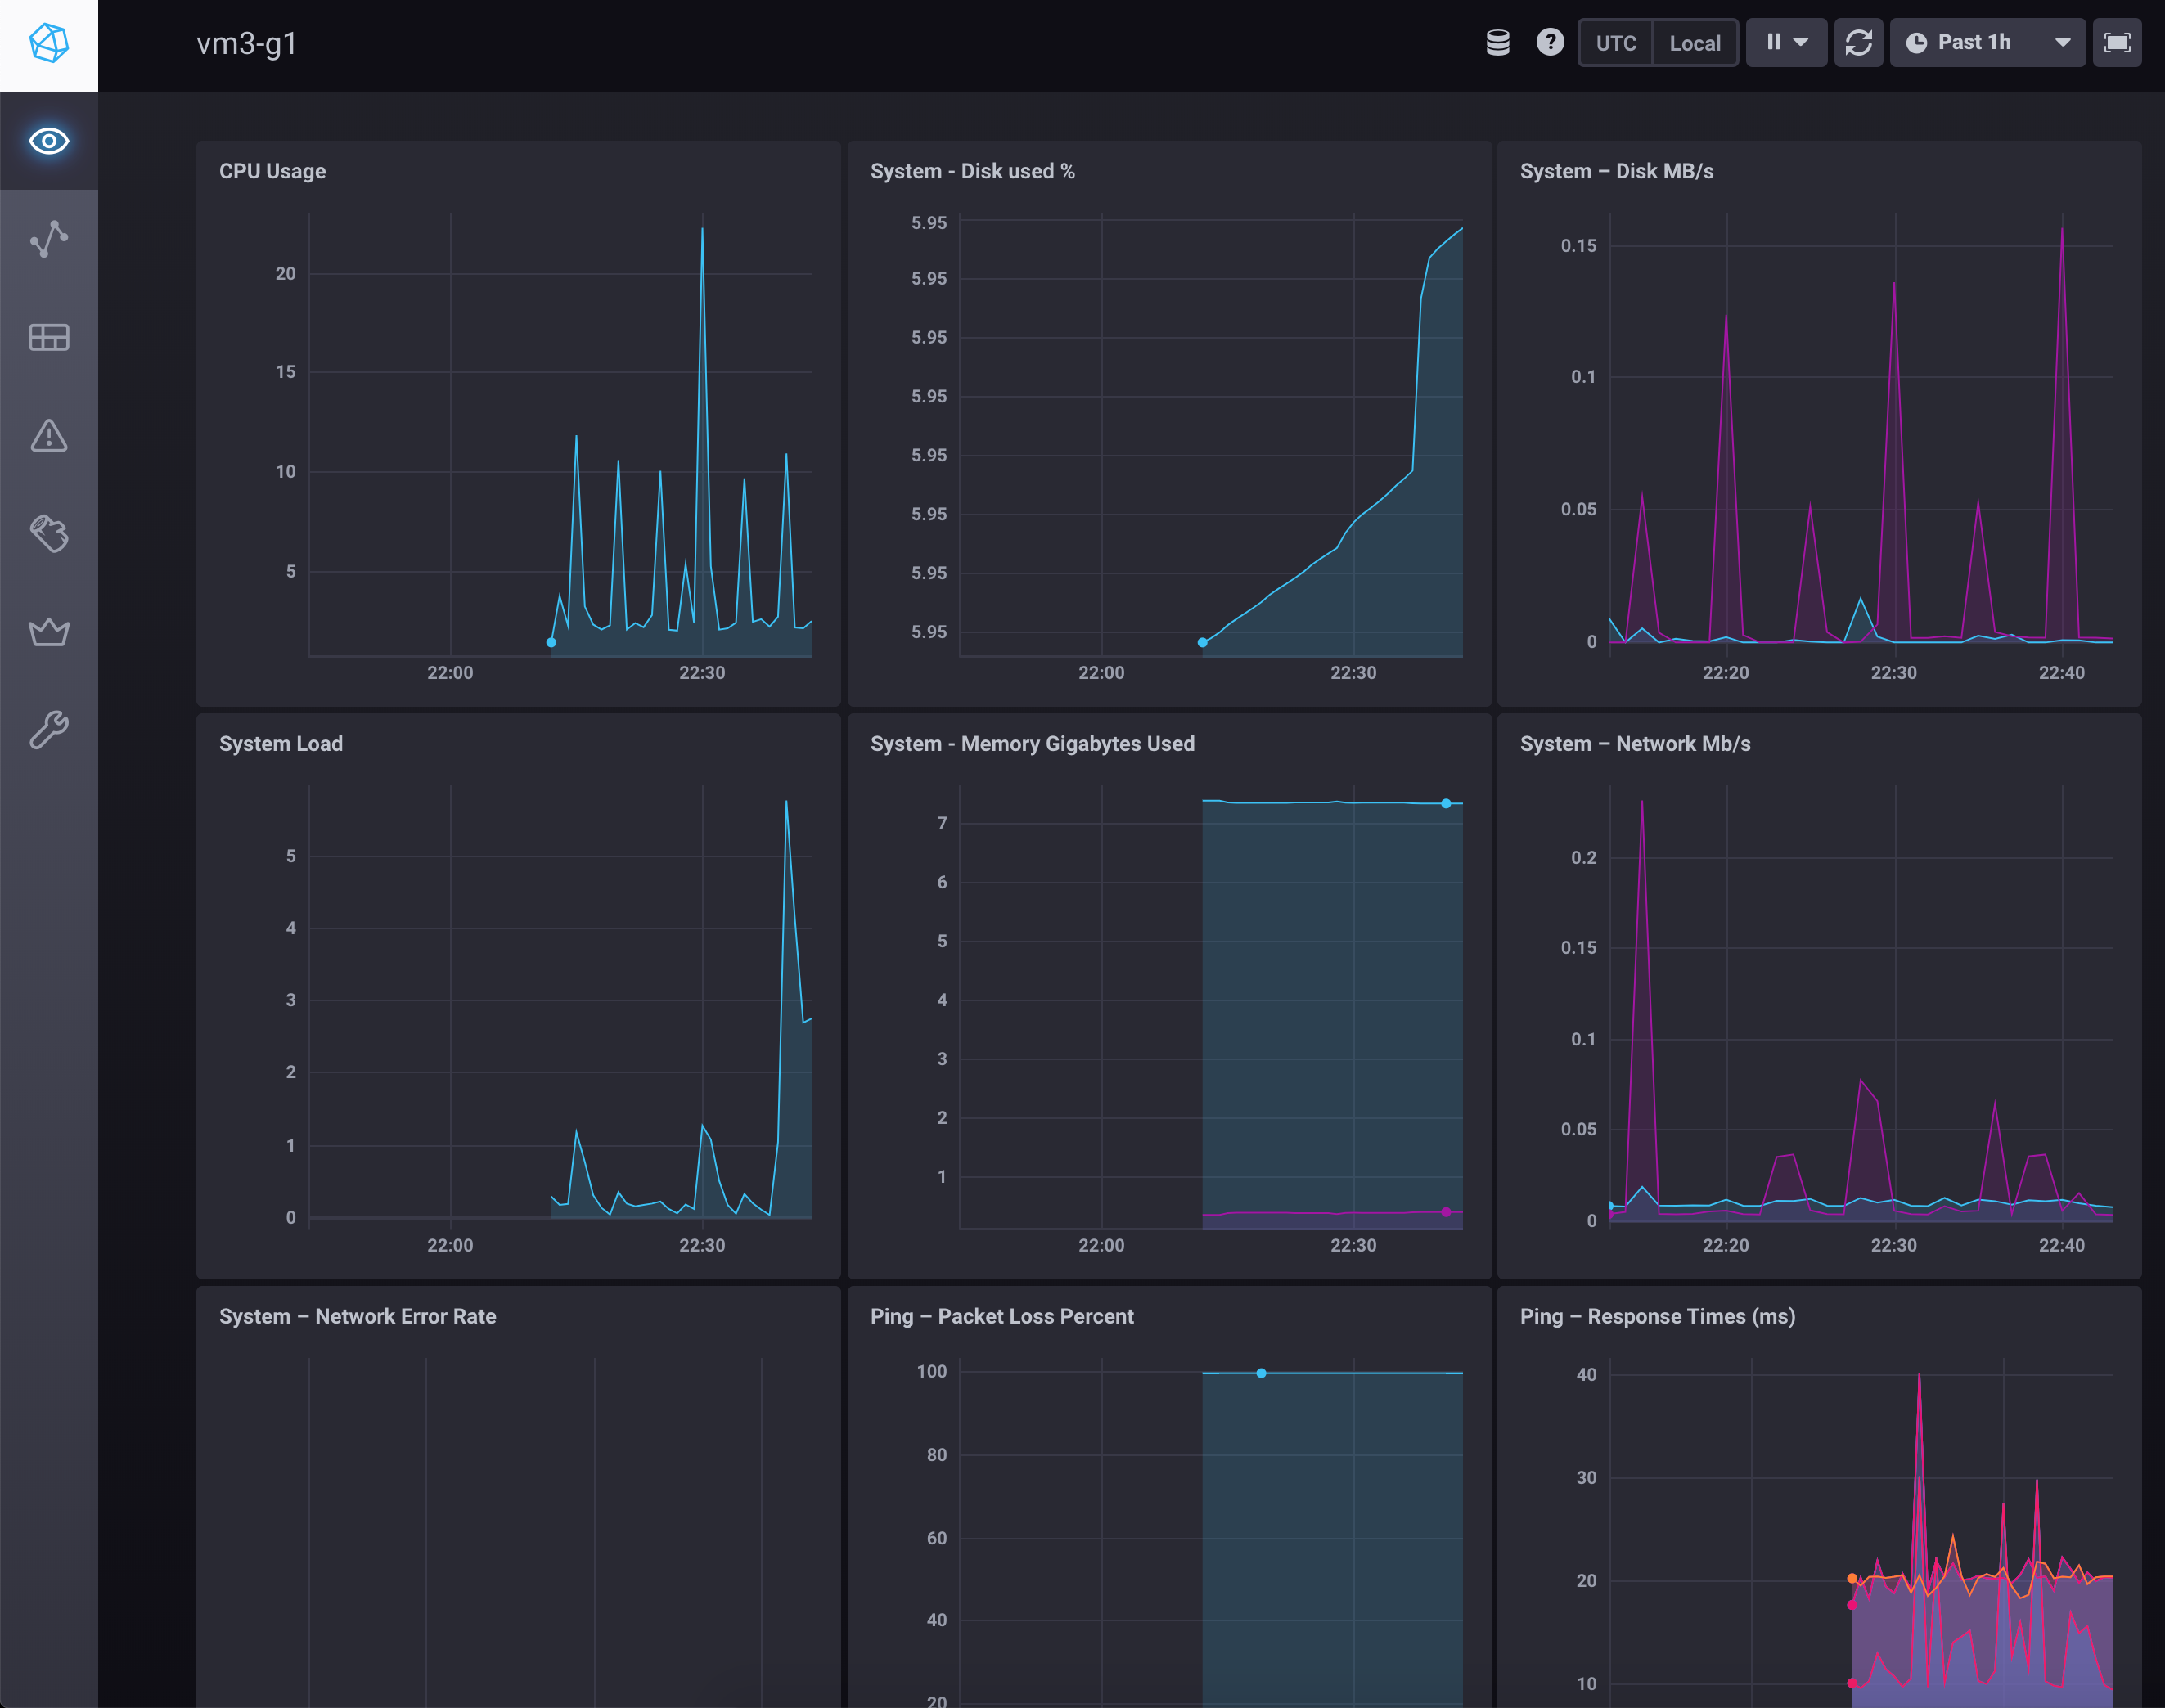
Hover over the left navigation menu, find the Host List section and Click on Host List
You will see your host details and click on you short hostname you will see detail graphs for your host.
Next we will create custom dashboard for your router (SNMP Datasource query)
Hover over the left navigation menu, find the Dashboard section and Click on Dashboard then click on Create Dashboard
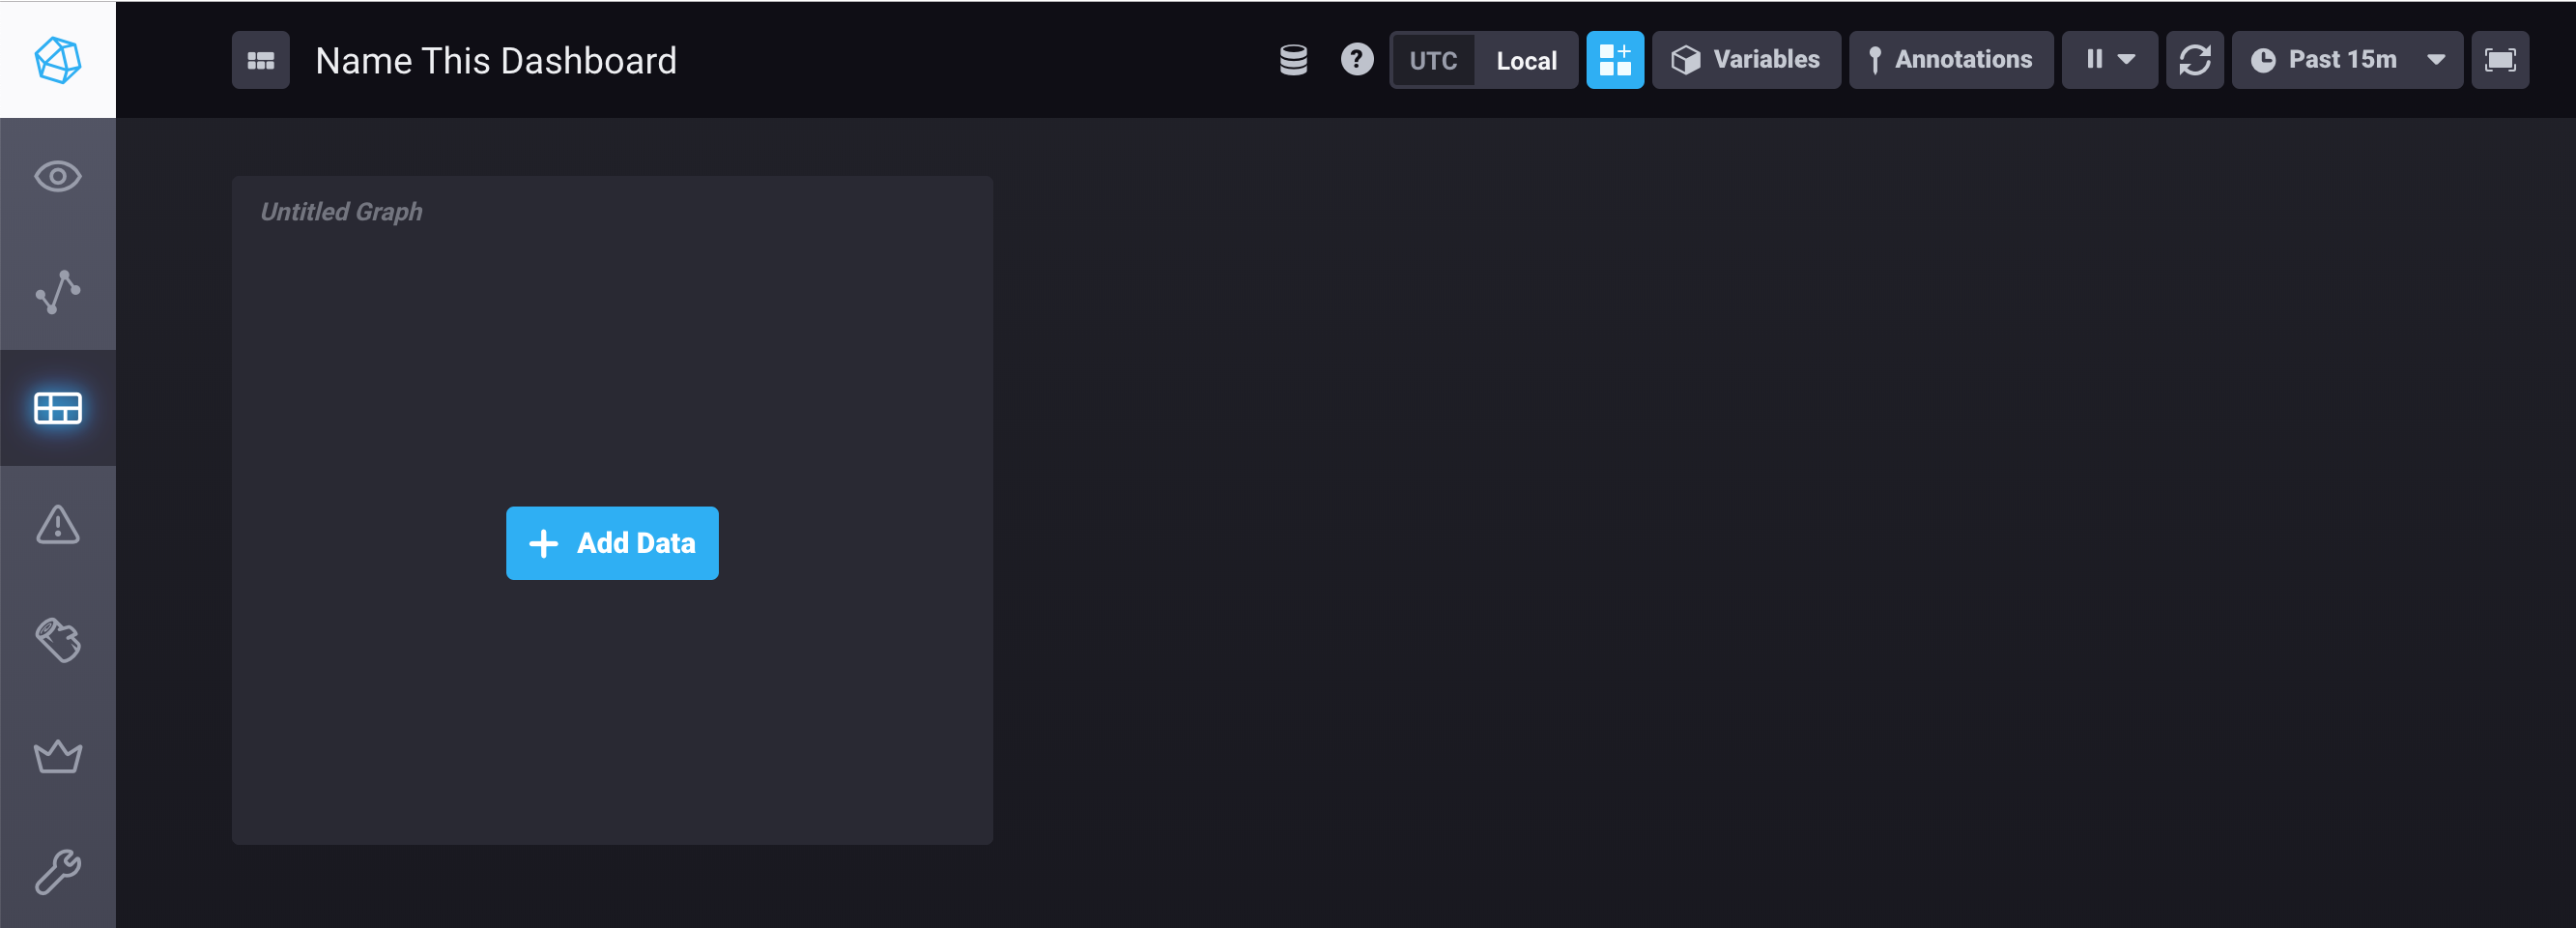
Now Click on Name This Dashboard and give a name as SNMP Data
Next click Add Data button then you will see following
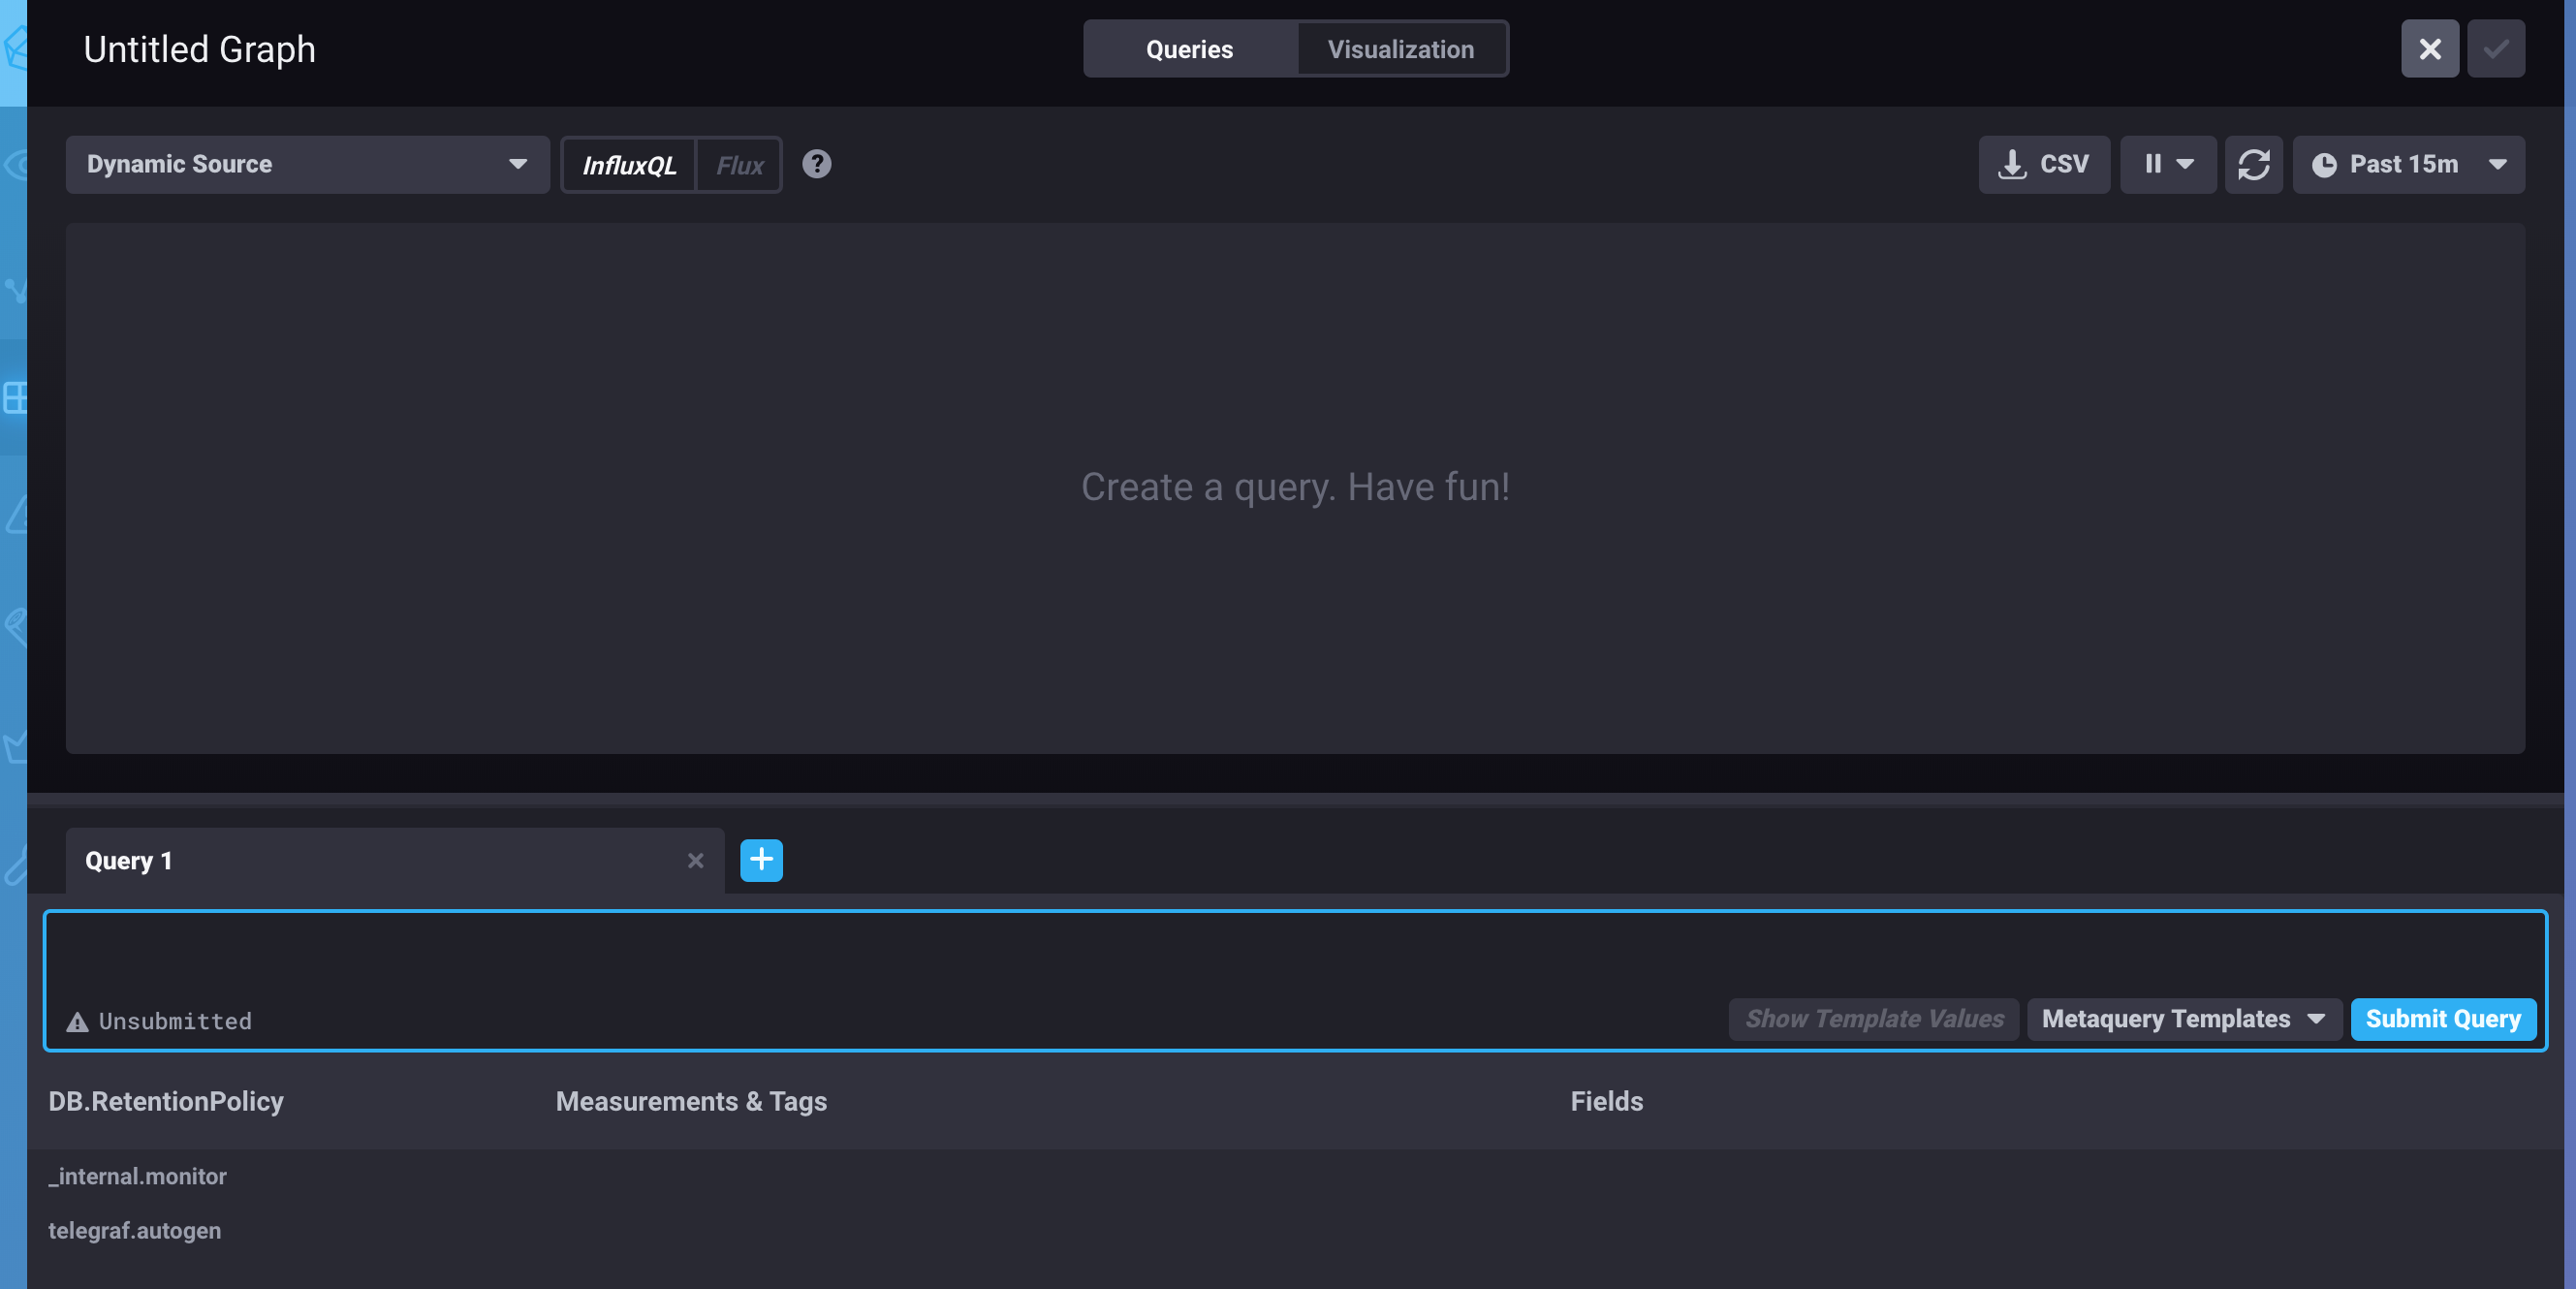
now click on Untitled Graph and change to System Uptime
then on Query 1 box copy and paste following content and click submit query button
SELECT last("uptime")/8460000 AS "uptime" FROM "telegraf"."autogen"."snmp" WHERE time > :dashboardTime: AND "hostname"=:hostname: FILL(previous)
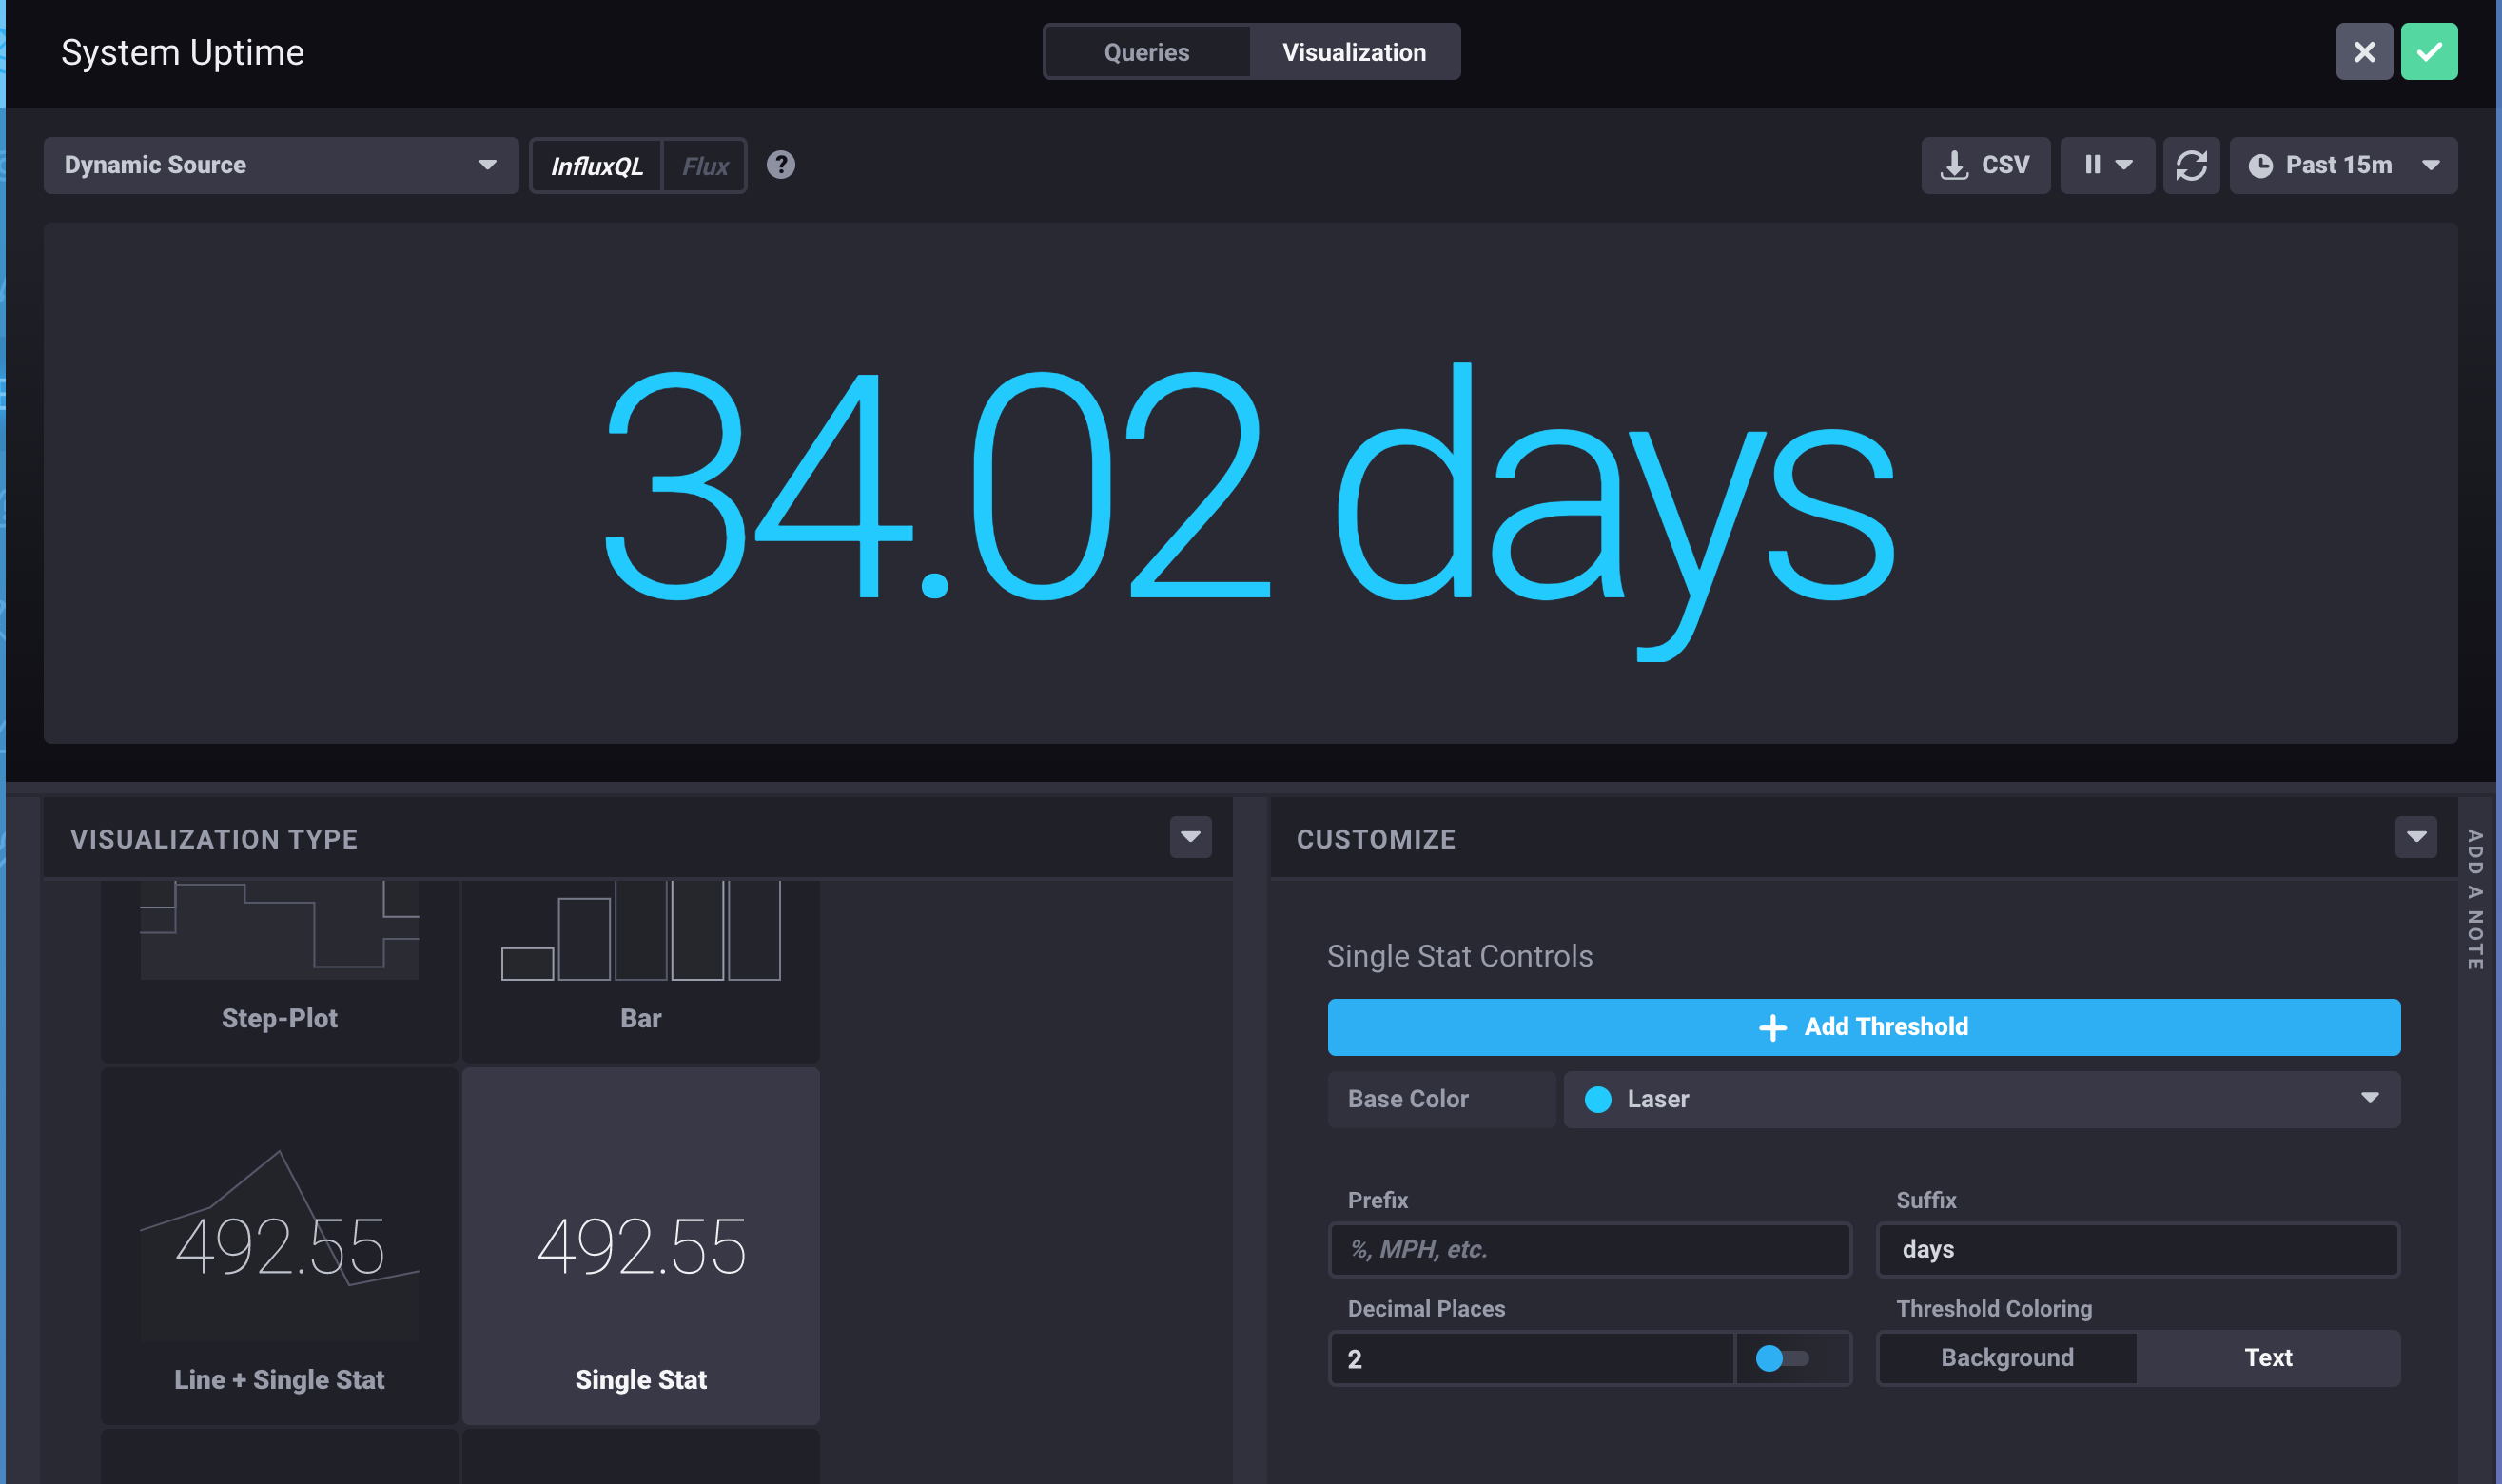
then click on Visualization button on top of window
then click on Single Stat as Visualization type
add days as suffix on customize then click on green check buttom at top of screen to add data
Now click on Add a Cell on Dashboard button beside Local at top
now click on Untitled Graph and change to Fa0/0
then on Query 1 box copy and paste following content and click submit query button and you will see a graph
SELECT DERIVATIVE(mean("ifOutOctets"), 1s) AS "mean_ifOutOctets" FROM "telegraf"."autogen"."interface" WHERE time > :dashboardTime: AND "ifDescr"='FastEthernet0/0' GROUP BY time(:interval:) FILL(null)
Click + button to add another query box and copy and paste following content and click submit query button and you will see a graph
SELECT DERIVATIVE(mean("ifInOctets"), 1s) AS "mean_ifInOctets" FROM "telegraf"."autogen"."interface" WHERE time > :dashboardTime: AND "ifDescr"='FastEthernet0/0' GROUP BY time(:interval:) FILL(null)
then click on Visualization button on top of window
on CUSTOMIZE section click K/M/G on Y-Value's Prefix
click on green check buttom at top of screen to add data
Now try to add graph visualization for router's interface named Fa0/1 by yourself.
Let’s set up a simple alert that looks for high CPU usage.
Hover over the left navigation menu, find the Alerting section and click Manage Tasks. Then click Build Alert Rule.
First Name this Alert Rule as CPU Load
On Time Series section, click on telegraf.autogen. Then select system from the list that appears. Then select load1. You will immediately see a corresponding graph in the section below.
On Condition section, Above the graph, locate the field that says Send Alert where load1 is Greater Than and enter 1.0 for the value.
On Message section, copy and paste the following text into the Alert Message field to configure the text of the alert message:
{{ .ID }} is {{ .Level }} value: {{ index .Fields "value" }}
You can hover your mouse over the entries in the Templates section to get descriptions of each field.
On Alert Handlers section, choose the email option from the Send this Alert to dropdown list and click Save Rule and Configure this Alert Handler
click SMTP then fill in with following data
From Email: tick@localhost To Email: lab@localhost click Configuration Enabled
click Save Changes
Now go back to Alerting -> Manage Tasks then click CPU Load
Again nn Alert Handlers section, choose the email option from the Send this Alert to dropdown list and enter your email address in the associated field.
By default, you will receive messages in the JSON format, like this:
Example message
{
    "Name":"system",
    "TaskName":"chronograf-v1-14b15b75-39d5-43c4-8a44-e39284dcbbc7",
    "Group":"nil",
    "Tags":{
        "host":"vm3-g1"
    },
    "ServerInfo":{
        "Hostname":"localhost",
        "ClusterID":"1903386e-3c7c-4778-9e10-7b30407bbdf8",
        "ServerID":"0897b609-eb75-45b8-b0ca-4addbc73dc8b"
    },
    "ID":"High CPU usage",
    "Fields":{
        "va= lue":1.04
    },
    "Level":"CRITICAL",
    "Time":"2019-11-27T18:31:00Z",
    "Duration":50000000000,
    "Message":"CPU Load is CRITICAL value: 1.04"
}
You can set up more human-readable messages for the mail alerts. To do this, enter your message in the text box with the Enter the body for your email here. Can contain html placeholder as
Your VM has {{ .Level }} level of {{ .ID }}.

Current CPU Load is {{ index .Fields "value" }}.
You can rename this rule by clicking its name on the top left corner of the page and entering a new name.
Finally, click Save Rule on the top right to finish configuring this rule.
To test this newly-created alert, login to your VM and create a CPU spike by using the dd command to read data from /dev/zero and send it to /dev/null:
lab@vmX-gY:~$ dd if=/dev/zero of=/dev/null
Let the command run for several minutes, which should be enough to create a spike. You can stop the command at any time by pressing CTRL+C.
After a while, you will receive an e-mail message. Additionally, you can see all of your alerts by clicking Alert history in the left navigation menu of the Chronograf user interface.
Note: Once you’ve verified that you can receive alerts, be sure to stop the dd command you started with CTRL+C.